SD5913 · WEEK 03
Numbers into pictures
A phenomenon, a file of numbers, and every way to look at it.
SD5913 · WEEK 03
Numbers into pictures
A phenomenon, a file of numbers, and every way to look at it.
SD5913 · WEEK 03
Today
01
Assignment 2: a natural phenomenon, and a picture of it
02
Twenty-four numbers — a loop and a function
03
Where the numbers come from
04
Dimensions, vectors, transformations
05
Plotting: the same numbers, five ways
06
Two paths — designer, artist
07
Workshop — your repo, your first picture
SD5913 · WEEK 03 · WORDS
Words you will hear today
data — numbers somebody measured and published. JSON — a common file format for them: lists and dicts, written out as text.
parse — turn a file of text into lists and numbers you can use. cache — fetch once, save the file, read the file from then on.
plot — draw numbers as a picture. axis — one direction of the picture, and what it means: hour across, metres up.
vector — a list of numbers where each position means something: (hour, height). transformation — a rule that turns one vector into another.
frame — one picture of an animation. library — code somebody else wrote, that draws for you.
Every word from the slides, in plain language: sd5913.github.io/teaching/glossary.html
01 · ASSIGNMENT 1
It closed on Sunday
Marking starts this week. What a passing repo looked like, in three lines:
Two files at the top level, with those exact names: README.md and PROCESS.md. A PROCESS.md in a subfolder is a missing PROCESS.md.
A References heading with real entries under it. It is the check's most common complaint, and the cheapest one to have fixed.
Commits on more than one day. One commit called Initial commit says the essay arrived from somewhere else, whether or not it did.
Late work is marked, with the late penalty in the course outline. Submit it anyway — a late repo is worth more than no repo.
01 · WEEK 02
We stopped halfway. The rest is still there.
Week 2 ran to the mark at the design brief. The second half — the six types, reading the Nake rule, the four surprises, uv — was never delivered out loud.
It is all in the browser: sd5913.github.io/teaching/week02/. Every drill still runs, still checks itself, still keeps your answer.
The tutorial week02/README.md is the long version, with the faults and the spec exercise.
Today needs two facts from it, and they are on the slides when they are needed. You are not behind.
QUESTION · Word cloud
Name a natural phenomenon.
One or two words. Tide, rain, wind, moon, birds, earthquakes. Traffic is not one.
02 · ASSIGNMENT 2
Numbers about a natural phenomenon, and a picture
obtain
From a file somebody publishes
JSON, CSV or an HTML page. Somebody already did the measuring — the Observatory, the USGS, Wikipedia. The raw file you fetched is committed in data/.
make
A picture from them
Informative, artistic, or animated. Any library. The script says what it needs, so it runs on somebody else's machine.
say
What it is, and where it came from
README.md: the phenomenon, the source as a link, the picture, how to run it. PROCESS.md as before. Commits over more than one day.
due
Sunday 4 October, 23:59
10% of the course. A repo on your own account, the URL on Canvas. Set today, so you have two and a half weeks.
02 · ASSIGNMENT 2
What a finished repo looks like
README.md — the phenomenon, the source as a link that works, the picture embedded, how to run it.
PROCESS.md — the tools, one thing kept, one thing rejected and why.
data/ — the raw file you fetched, committed. That is what makes the repo still run a year from now, with no internet.
out/ — the picture, so the README can show it.
tidal-clock/
├── README.md      the phenomenon, the
│                  source, the picture
├── PROCESS.md     how you used AI
├── tide_clock.py  with a # /// script
│                  block at the top
├── data/
│   └── tides-QUB-2026.json
└── out/
    └── tide-clock.png
02 · ASSIGNMENT 2
Name it properly, before you start
We said this in week 2 and it applies from today: the repo name is the first thing anyone sees, and it is in your portfolio for longer than it is in my gradebook.
Bad: assignment2 · ass2 · data-viz-final-FINAL
Good: tidal-clock · quakes-this-month · rainfall-kowloon
Short, lowercase, hyphens, and it says what the thing does. You can rename a GitHub repo later, but the URL you put on Canvas will not follow.
03 · THE NUMBERS
Twenty-four numbers.
How many ways can you look at them?
03 · THE NUMBERS
The tide at Quarry Bay, today
# Hong Kong Observatory, station QUB, 17 September 2026
# metres above chart datum, one per hour, 01:00 to 24:00

heights = [2.19, 2.09, 1.90, 1.63, 1.36,
           1.14, 1.05, 1.08, 1.15, 1.24,
           1.29, 1.35, 1.44, 1.47, 1.47,
           1.42, 1.38, 1.38, 1.46, 1.65,
           1.86, 2.04, 2.14, 2.17]

print(len(heights), min(heights), max(heights))
data.weather.gov.hk · one row of a file with 365 of them · the tutorial fetches it, this deck quotes it
03 · D1 · A LOOP
Once for each number
A loop does the indented lines once for every item. enumerate hands you the position too, and start=1 makes the first hour 1, not 0.
How many lines will it print? Say it, then run it.
Now change one character: print the hours under 1.1.
03 · A LOOP
That is a loop, and that is all of it
for hour, height in enumerate(heights, start=1):
once for each item — twenty-four numbers, twenty-four turns
the names change each turn — hour and height mean something different every time round
the indented lines are what happens — the four spaces are the loop
Everything else today is this, with something other than print at the end.
03 · D2 · A FUNCTION
It prints None twenty-four times
bar is a rule with a name: a height goes in, a row of # should come out. "#" * 11 is eleven hashes — * repeats text.
Run it. One word is missing. Find it, and make it print bars.
03 · THE FIRST PICTURE
No library drew this
Twenty-four rows of hashes, one call of bar each. It is a bar chart, and it is nine lines of Python.
Quarry Bay, 17 September 2026 · teal is low water at 07:00, orange is high water at 01:00
03 · A FUNCTION
A rule with a name
def bar(height): — something goes in, something comes out.
The name in the brackets is a name for whatever you hand it. It exists only inside.
No {mono:return, nothing comes out.} Python hands back None, silently, and your picture is empty for a reason you cannot see.
Four spaces of indentation say which lines are inside the function.
This is the mistake generated code makes more than any other. You just found it.
03 · D3 · HIGHEST
When is high water?
A loop that remembers: keep the biggest height you have seen, and the hour it happened. best carries from one turn to the next — that is state.
Fill in the ___. Predict the answer first — you have seen the picture.
03 · THE TOOLKIT
That was the whole toolkit
A loop over the numbers. A function per number. That is it.
Everything for the rest of today is those two, with something else at the end of the loop: a library drawing a line instead of print writing hashes.
The picture is the check. If the bars had come out flat, you would have known — which is more than most tests tell you.
04 · THE SOURCE
Somebody already did the measuring
# one address, and 365 days come back
https://data.weather.gov.hk/weatherAPI/opendata/opendata.php
    ?dataType=HHOT&station=QUB&year=2026&rformat=json

# what it says, with most of it cut out
{"fields": ["MM", "DD", "01", "02", ..., "24"],
 "data": [["01", "01", "0.68", "0.64", ..., "1.09"],
          ["01", "02", "0.69", "0.46", ..., "0.85"],
          ["09", "17", "2.19", "2.09", ..., "2.17"]]}
HHOT = hourly heights of tide · QUB = Quarry Bay · the whole year is 66 KB
04 · JSON
A dict of lists of lists, and one way in
Square brackets ask a dict and a list the same question: give me the one at ___. A dict answers to a name, a list to a position, counting from 0.
d["data"] — the list of 365 rows
d["data"][259] — row 259, which is 17 September
d["data"][259][2] — the first hour of that row: "2.19"
Three brackets, three steps, and you are at one number. Which is not yet a number — look at the quotes.
04 · JSON · MULTIPLE CHOICE
What type is d["data"][259][2]?
A
int
B
float
C
str
D
list
04 · D4 · READ THE FILE
The quotes are still there
Two rows of the real file. d["data"][1] is the 17th; position 8 in a row is 07:00, because 0 and 1 are the month and the day.
Make it print the 07:00 height as a number, plus one.
04 · FOUR RULES
Four rules for taking somebody else's numbers
cache
Fetch once, keep the file
Fetch, save the raw reply into data/, then parse the file. Your script runs with no internet, and the committed file is what makes the repo reproducible.
html
Same idea, messier
No JSON? A web page is a tree, and one line of BeautifulSoup walks it: select("table.wikitable"), then the rows. The typhoon season table on Wikipedia is one.
rot
Watch the line rot
The tidal-stream endpoint behind week 2's rings moved in 2023 — fetch_tides.py says so in a comment. A cached file outlives the URL it came from.
polite
Be polite
A User-Agent that says who you are and what for. One request, not a loop of them. You are a guest on somebody else's server.
05
Dimensions
A chart type is a transformation
05 · DIMENSIONS
One number, two numbers, three
1-D
A number on its own
A height. A time. A brightness. All you can do is put it somewhere on a line — or make it a length, which is what bar did.
2-D
Two numbers, and a decision
(hour, height) is a point on a plane. So is (lat, lng), and so is (angle, distance). Same pair, three different pictures.
3-D
Three, and something has to give
(lng, lat, magnitude) on a flat page: two go to position, the third to size, or colour. (r, g, b) is three numbers you see as one colour.
05 · VECTORS
A vector is a list with a meaning per position
(hour, height) — first the hour, then the metres. Swap them and the picture is nonsense, so the order is part of the meaning.
In Python it is a tuple: a list you do not change. Every dot on the right is one.
Week 2's rings read (knot, deg) — speed and direction — which is the same idea in polar form.
24 vectors, drawn where they say to draw them
05 · TRANSFORMATIONS
Three rules, three lines each
from math import cos, sin

shape = [(0, 0), (100, 0), (50, 80)]

def move(p, dx, dy):
    return (p[0] + dx, p[1] + dy)

def scale(p, k):
    return (p[0] * k, p[1] * k)

def rotate(p, a):
    return (p[0] * cos(a) - p[1] * sin(a),
            p[0] * sin(a) + p[1] * cos(a))

moved = [move(p, 70, 40) for p in shape]
the faint triangle is the original · a is in radians, so 0.5 is about 29°
05 · D5 · MOVE THE SHAPE
Predict the three points
One rule, applied to every point by a loop written on one line.
Say the three pairs out loud before you run it. Then fill in the blank.
05 · MATRICES
Those three rules have one name
Rotate-and-scale together is four numbers in a 2×2 table, and the table is the transformation. Put the numbers in, get the moved point out.
Matplotlib, CSS and p5.js all call it transform. Same idea, three spellings.
Chaining two of them — rotate, then scale — is one multiplication, done once, then applied to every point.
You do not need the multiplication rule this week. You need to recognise the word when a library or an assistant uses it.
05 · BENT
The same 24 numbers, bent into a circle
the clock is to_xy(hour, height) applied to every pair · midnight at the right, the day running clockwise
05 · D6 · POLAR TO XY
Round, into flat
The clock in two lines: the hour decides the angle, the height decides the radius. cos and sin turn that pair back into x and y.
One full turn is 24 hours, and a full turn is 2 * math.pi. Fill in the angle.
05 · WEEK 2 WAS THIS
The rings you ran last week were this
tides.py in week 2 drew twenty-four rings of tidal current. Every one of them:
a circle — to_xy in a loop, 200 times round
scale — ring n drawn at (n + 1) / 24 of full size
move — to the centre of the window
then each vertex pushed by one (knot, deg) vector from the data
You ran it without knowing that. Open pfad/week02/tides/tides.svg again.
the same construction, one ring, the tide height instead of the current
06
Plotting
The library runs the loop; you still choose the axes
06 · MATPLOTLIB
Eight lines, and the loop is gone
import json
import matplotlib.pyplot as plt

d = json.load(open("data/tides-QUB-2026.json"))
row = d["data"][259]          # 17 September
heights = [float(v) for v in row[2:]]
hours = range(1, 25)

plt.plot(hours, heights)
plt.xlabel("hour")
plt.ylabel("metres above chart datum")
plt.savefig("out/tide-day.png", dpi=150)
plt.show()
the file comes from data/, the picture goes to out/ · both are committed
06 · FIVE WAYS
The same numbers, five ways
a line · bars · the clock · thirty days overlaid · September as a grid, one row per day, one cell per hour
06 · THE MOON · MULTIPLE CHOICE
When are the tides biggest?
A
New and full moon
B
Half moon
C
The same all month
D
When it rains
06 · THE MOON
Five lines of astronomy
from datetime import date
from tides import load_year

NEW_MOON = date(2000, 1, 6)     # a known new moon

def moon_age(day):
    return (day - NEW_MOON).days % 29.53

days, ranges = [], []
for day, heights in load_year():
    if day.month != 9:
        continue
    days.append(day.day)
    ranges.append(max(heights) - min(heights))

plt.bar(days, ranges)
plt.savefig("out/moon.png")
daily range against the day · the moon marks come from moon_age
06 · THREE NUMBERS
Three numbers a point, and the map draws itself
Every earthquake of the last month: (lng, lat, magnitude).
Two numbers become position — longitude across, latitude up. That is the cheapest map projection there is, and it is a transformation you did not write.
The third becomes size. It could have been colour.
Nobody drew the coastlines. The plate boundaries drew themselves.
USGS, magnitude 2.5+, one month · 2,130 points, largest 6.7
06 · A FRAME IS A FUNCTION OF TIME
Animation is a loop with a picture in it
One more number, one more dimension: i, which frame it is.
def frame(i): draws the first i hours — nothing else changes. The library calls it 24 times and saves the pictures in order.
A function of time is all an animation is. The hand is the hour it is drawing.
06 · MAKE IT MOVE
Ten lines, and it is a GIF
from matplotlib.animation import FuncAnimation

fig, ax = plt.subplots()

def frame(i):                  # i counts up: 0, 1, 2, ...
    ax.clear()
    ax.plot(hours[:i], heights[:i])

anim = FuncAnimation(fig, frame, frames=25, interval=80)
anim.save("out/tide-clock.gif", writer="pillow")
pfad/week03/animate.py · needs pillow, which the script block asks for
07 · TWO PATHS
Both of these are assignment 2
The designer. Pick the chart the dimensions ask for. Label the axes. One message per picture.
Someone who was not in the room has to get the answer without you next to them.
The artist. The numbers are material. Week 2's rings do not tell you the current at 14:00 and never meant to.
The picture need not explain itself — but you still say where the numbers came from, and they are still real measurements.
designer
  one question, one picture
  axes labelled, units named
  the source, as a link

artist
  the numbers are the material
  the rule is yours
  the source, as a link

both
  it runs on somebody else's
  machine, from a cached file
07 · TWO PATHS · ONE EXAMPLE
What assignment 2 can look like
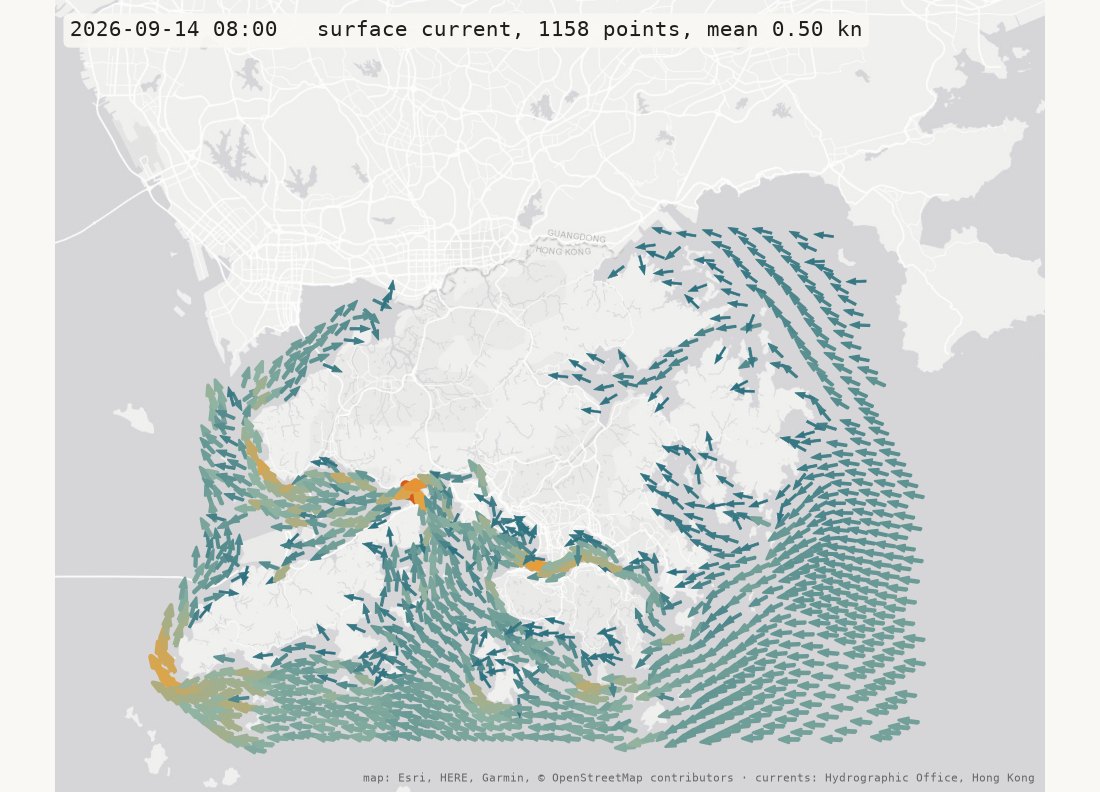
Week 2's current data, five days of it, with the two numbers the rings threw away put back: longitude and latitude. Every arrow returns to its place in the sea; 120 hours become 120 frames, ten tides in ten seconds.
to_xy — the bearing into a vector, as on the clock
to_pixel — the round Earth onto the flat map tiles
frame(i) — one hour into one picture
week03/currents.py · --drift lets 2,500 specks of water ride the arrows instead. One published file, one picture nobody could draw by hand.
github.com/sd5913/tidal-streams — the finished repo · sd5913.github.io/tidal-streams — the page, live
07 · TWO PATHS · PUBLISHED
The page builds itself
The same arrows once more, as a web page: currents_web.py writes one HTML file with folium, and the browser does the drawing — pan, zoom, a play button.
Open the file on your laptop. If it plays there, it plays anywhere.
Then one workflow file from assignments/pages.yml: on every push, GitHub runs the same command you ran and publishes the result at you.github.io/your-repo.
site/ is never committed. It is made fresh from data/ every time.
on:
  push:
    branches: [main]

jobs:
  build:
    steps:
      - uses: actions/checkout@v4
      - uses: astral-sh/setup-uv@v6
      - run: uv run currents_web.py
      - uses: actions/upload-pages-artifact@v3
        with: { path: site }
  deploy:
    needs: build
    steps:
      - uses: actions/deploy-pages@v4
QUESTION · Short answer
Your phenomenon, and where its numbers come from.
One line. For example: rainfall · HKO daily extract · JSON.
Not sure yet? Say the phenomenon on its own and we will find you a file.
08
Workshop
Your numbers, your repo, your first picture
08 · WORKSHOP
The tutorial is in the repo
Everything for the next two hours is one folder in the course repo, and the walkthrough is its README:
github.com/sd5913/pfad · week03/README.md
git pull brings it down; uv run tides.py is the first thing it asks for.
No clone, or a lab machine you have not used? Download and double-click setup.bat.
Everything in week03/ runs from the cached files in data/, so it works with the wifi off. Leave with a repo, a data file and one picture in it.
08 · WORKSHOP
Two hours
0:00
uv run tides.py
The year, cached to data/, and today's 24 numbers as a text chart. D2 on the real file.
0:15
One day, four ways
plot_day.py, tide_clock.py, tide_month.py, moon.py. Predict, run, change one knob.
0:40
Make it move
animate.py sweeps the clock and writes a GIF into out/.
0:55
Three numbers
earthquakes.py — a map sized by magnitude; currents.py — week 2's arrows back on the map, moving.
1:10
Same idea, messier
typhoons.py — an HTML table, wind against pressure.
1:20
Your repo
New repo, the tree from the brief, your file cached, one plot, the check, the workflow, the URL on Canvas.
1:50
Upload
Your plot to ClassPoint. Caption: phenomenon · source.
QUESTION · Image upload
Upload your first plot.
Caption, 50 characters or fewer: phenomenon · source.
e.g. "tide at Quarry Bay · HKO hourly JSON" (36 characters)
See you next week
Week 4: interfaces. Assignment 2 is due Sunday 4 October.
sd5913.github.io/teaching
a·t4x
SD5913 · WEEK 03
A phenomenon, a file of numbers, and every way to look at it.
SD5913 · WEEK 03
01 Assignment 2: a natural phenomenon, and a picture of it
02 Twenty-four numbers — a loop and a function
03 Where the numbers come from
04 Dimensions, vectors, transformations
05 Plotting: the same numbers, five ways
06 Two paths — designer, artist
07 Workshop — your repo, your first picture
SD5913 · WEEK 03 · WORDS
(hour, height). transformation — a rule that turns one vector into another.Every word from the slides, in plain language: sd5913.github.io/teaching/glossary.html
01 · ASSIGNMENT 1
Marking starts this week. What a passing repo looked like, in three lines:
README.md and PROCESS.md. A PROCESS.md in a subfolder is a missing PROCESS.md.Initial commit says the essay arrived from somewhere else, whether or not it did.Late work is marked, with the late penalty in the course outline. Submit it anyway — a late repo is worth more than no repo.
01 · WEEK 02
Week 2 ran to the mark at the design brief. The second half — the six types, reading the Nake rule, the four surprises, uv — was never delivered out loud.
week02/README.md is the long version, with the faults and the spec exercise.Today needs two facts from it, and they are on the slides when they are needed. You are not behind.
QUESTION · WORD CLOUD
One or two words. Tide, rain, wind, moon, birds, earthquakes. Traffic is not one.
ClassPoint · word cloud — answer on the projector
02 · ASSIGNMENT 2
OBTAIN
From a file somebody publishes
JSON, CSV or an HTML page. Somebody already did the measuring — the Observatory, the USGS, Wikipedia. The raw file you fetched is committed in data/.
MAKE
A picture from them
Informative, artistic, or animated. Any library. The script says what it needs, so it runs on somebody else's machine.
SAY
What it is, and where it came from
README.md: the phenomenon, the source as a link, the picture, how to run it. PROCESS.md as before. Commits over more than one day.
DUE
Sunday 4 October, 23:59
10% of the course. A repo on your own account, the URL on Canvas. Set today, so you have two and a half weeks.
02 · ASSIGNMENT 2
README.md — the phenomenon, the source as a link that works, the picture embedded, how to run it.
PROCESS.md — the tools, one thing kept, one thing rejected and why.
data/ — the raw file you fetched, committed. That is what makes the repo still run a year from now, with no internet.
out/ — the picture, so the README can show it.
tidal-clock/
├── README.md the phenomenon, the
│ source, the picture
├── PROCESS.md how you used AI
├── tide_clock.py with a # /// script
│ block at the top
├── data/
│ └── tides-QUB-2026.json
└── out/
└── tide-clock.png
02 · ASSIGNMENT 2
We said this in week 2 and it applies from today: the repo name is the first thing anyone sees, and it is in your portfolio for longer than it is in my gradebook.
assignment2 · ass2 · data-viz-final-FINALtidal-clock · quakes-this-month · rainfall-kowloonShort, lowercase, hyphens, and it says what the thing does. You can rename a GitHub repo later, but the URL you put on Canvas will not follow.
03 · THE NUMBERS
03 · THE NUMBERS
# Hong Kong Observatory, station QUB, 17 September 2026 # metres above chart datum, one per hour, 01:00 to 24:00 heights = [2.19, 2.09, 1.90, 1.63, 1.36, 1.14, 1.05, 1.08, 1.15, 1.24, 1.29, 1.35, 1.44, 1.47, 1.47, 1.42, 1.38, 1.38, 1.46, 1.65, 1.86, 2.04, 2.14, 2.17] print(len(heights), min(heights), max(heights))
data.weather.gov.hk · one row of a file with 365 of them · the tutorial fetches it, this deck quotes it
03 · D1 · A LOOP
A loop does the indented lines once for every item. enumerate hands you the position too, and start=1 makes the first hour 1, not 0.
How many lines will it print? Say it, then run it.
Now change one character: print the hours under 1.1.
03 · A LOOP
for hour, height in enumerate(heights, start=1):
hour and height mean something different every time roundEverything else today is this, with something other than print at the end.
03 · D2 · A FUNCTION
bar is a rule with a name: a height goes in, a row of # should come out. "#" * 11 is eleven hashes — * repeats text.
Run it. One word is missing. Find it, and make it print bars.
03 · THE FIRST PICTURE
Twenty-four rows of hashes, one call of bar each. It is a bar chart, and it is nine lines of Python.
Quarry Bay, 17 September 2026 · teal is low water at 07:00, orange is high water at 01:00
03 · A FUNCTION
def bar(height): — something goes in, something comes out.
None, silently, and your picture is empty for a reason you cannot see.This is the mistake generated code makes more than any other. You just found it.
03 · D3 · HIGHEST
A loop that remembers: keep the biggest height you have seen, and the hour it happened. best carries from one turn to the next — that is state.
Fill in the ___. Predict the answer first — you have seen the picture.
03 · THE TOOLKIT
A loop over the numbers. A function per number. That is it.
Everything for the rest of today is those two, with something else at the end of the loop: a library drawing a line instead of print writing hashes.
The picture is the check. If the bars had come out flat, you would have known — which is more than most tests tell you.
04 · THE SOURCE
# one address, and 365 days come back https://data.weather.gov.hk/weatherAPI/opendata/opendata.php ?dataType=HHOT&station=QUB&year=2026&rformat=json # what it says, with most of it cut out {"fields": ["MM", "DD", "01", "02", ..., "24"], "data": [["01", "01", "0.68", "0.64", ..., "1.09"], ["01", "02", "0.69", "0.46", ..., "0.85"], ["09", "17", "2.19", "2.09", ..., "2.17"]]}
HHOT = hourly heights of tide · QUB = Quarry Bay · the whole year is 66 KB
04 · JSON
Square brackets ask a dict and a list the same question: give me the one at ___. A dict answers to a name, a list to a position, counting from 0.
d["data"] — the list of 365 rowsd["data"][259] — row 259, which is 17 Septemberd["data"][259][2] — the first hour of that row: "2.19"Three brackets, three steps, and you are at one number. Which is not yet a number — look at the quotes.
04 · JSON · MULTIPLE CHOICE
A int
B float
C str
D list
ClassPoint · multiple choice — answer on the projector
04 · D4 · READ THE FILE
Two rows of the real file. d["data"][1] is the 17th; position 8 in a row is 07:00, because 0 and 1 are the month and the day.
Make it print the 07:00 height as a number, plus one.
04 · FOUR RULES
CACHE
Fetch once, keep the file
Fetch, save the raw reply into data/, then parse the file. Your script runs with no internet, and the committed file is what makes the repo reproducible.
HTML
Same idea, messier
No JSON? A web page is a tree, and one line of BeautifulSoup walks it: select("table.wikitable"), then the rows. The typhoon season table on Wikipedia is one.
ROT
Watch the line rot
The tidal-stream endpoint behind week 2's rings moved in 2023 — fetch_tides.py says so in a comment. A cached file outlives the URL it came from.
POLITE
Be polite
A User-Agent that says who you are and what for. One request, not a loop of them. You are a guest on somebody else's server.
05
A CHART TYPE IS A TRANSFORMATION
05 · DIMENSIONS
1-D
A height. A time. A brightness. All you can do is put it somewhere on a line — or make it a length, which is what bar did.
2-D
(hour, height) is a point on a plane. So is (lat, lng), and so is (angle, distance). Same pair, three different pictures.
3-D
(lng, lat, magnitude) on a flat page: two go to position, the third to size, or colour. (r, g, b) is three numbers you see as one colour.
05 · VECTORS
(hour, height) — first the hour, then the metres. Swap them and the picture is nonsense, so the order is part of the meaning.
In Python it is a tuple: a list you do not change. Every dot on the right is one.
Week 2's rings read (knot, deg) — speed and direction — which is the same idea in polar form.
24 vectors, drawn where they say to draw them
05 · TRANSFORMATIONS
from math import cos, sin shape = [(0, 0), (100, 0), (50, 80)] def move(p, dx, dy): return (p[0] + dx, p[1] + dy) def scale(p, k): return (p[0] * k, p[1] * k) def rotate(p, a): return (p[0] * cos(a) - p[1] * sin(a), p[0] * sin(a) + p[1] * cos(a)) moved = [move(p, 70, 40) for p in shape]
the faint triangle is the original · a is in radians, so 0.5 is about 29°
05 · D5 · MOVE THE SHAPE
One rule, applied to every point by a loop written on one line.
Say the three pairs out loud before you run it. Then fill in the blank.
05 · MATRICES
Rotate-and-scale together is four numbers in a 2×2 table, and the table is the transformation. Put the numbers in, get the moved point out.
transform. Same idea, three spellings.You do not need the multiplication rule this week. You need to recognise the word when a library or an assistant uses it.
05 · BENT
the clock is to_xy(hour, height) applied to every pair · midnight at the right, the day running clockwise
05 · D6 · POLAR TO XY
The clock in two lines: the hour decides the angle, the height decides the radius. cos and sin turn that pair back into x and y.
One full turn is 24 hours, and a full turn is 2 * math.pi. Fill in the angle.
05 · WEEK 2 WAS THIS
tides.py in week 2 drew twenty-four rings of tidal current. Every one of them:
to_xy in a loop, 200 times roundscale — ring n drawn at (n + 1) / 24 of full sizemove — to the centre of the window(knot, deg) vector from the dataYou ran it without knowing that. Open pfad/week02/tides/tides.svg again.
the same construction, one ring, the tide height instead of the current
06
THE LIBRARY RUNS THE LOOP; YOU STILL CHOOSE THE AXES
06 · MATPLOTLIB
import json import matplotlib.pyplot as plt d = json.load(open("data/tides-QUB-2026.json")) row = d["data"][259] # 17 September heights = [float(v) for v in row[2:]] hours = range(1, 25) plt.plot(hours, heights) plt.xlabel("hour") plt.ylabel("metres above chart datum") plt.savefig("out/tide-day.png", dpi=150) plt.show()
the file comes from data/, the picture goes to out/ · both are committed
06 · FIVE WAYS
a line · bars · the clock · thirty days overlaid · September as a grid, one row per day, one cell per hour
06 · THE MOON · MULTIPLE CHOICE
A New and full moon
B Half moon
C The same all month
D When it rains
ClassPoint · multiple choice — answer on the projector
06 · THE MOON
from datetime import date from tides import load_year NEW_MOON = date(2000, 1, 6) # a known new moon def moon_age(day): return (day - NEW_MOON).days % 29.53 days, ranges = [], [] for day, heights in load_year(): if day.month != 9: continue days.append(day.day) ranges.append(max(heights) - min(heights)) plt.bar(days, ranges) plt.savefig("out/moon.png")
daily range against the day · the moon marks come from moon_age
06 · THREE NUMBERS
Every earthquake of the last month: (lng, lat, magnitude).
Nobody drew the coastlines. The plate boundaries drew themselves.
USGS, magnitude 2.5+, one month · 2,130 points, largest 6.7
06 · A FRAME IS A FUNCTION OF TIME
One more number, one more dimension: i, which frame it is.
def frame(i): draws the first i hours — nothing else changes. The library calls it 24 times and saves the pictures in order.
A function of time is all an animation is. The hand is the hour it is drawing.
Open the live sketch › — it sweeps the day · click to start it again
06 · MAKE IT MOVE
from matplotlib.animation import FuncAnimation fig, ax = plt.subplots() def frame(i): # i counts up: 0, 1, 2, ... ax.clear() ax.plot(hours[:i], heights[:i]) anim = FuncAnimation(fig, frame, frames=25, interval=80) anim.save("out/tide-clock.gif", writer="pillow")
pfad/week03/animate.py · needs pillow, which the script block asks for
07 · TWO PATHS
The designer. Pick the chart the dimensions ask for. Label the axes. One message per picture.
Someone who was not in the room has to get the answer without you next to them.
The artist. The numbers are material. Week 2's rings do not tell you the current at 14:00 and never meant to.
The picture need not explain itself — but you still say where the numbers came from, and they are still real measurements.
designer one question, one picture axes labelled, units named the source, as a link artist the numbers are the material the rule is yours the source, as a link both it runs on somebody else's machine, from a cached file
07 · TWO PATHS · ONE EXAMPLE
Week 2's current data, five days of it, with the two numbers the rings threw away put back: longitude and latitude. Every arrow returns to its place in the sea; 120 hours become 120 frames, ten tides in ten seconds.
to_xy — the bearing into a vector, as on the clockto_pixel — the round Earth onto the flat map tilesframe(i) — one hour into one pictureweek03/currents.py · --drift lets 2,500 specks of water ride the arrows instead. One published file, one picture nobody could draw by hand.
github.com/sd5913/tidal-streams — the finished repo · sd5913.github.io/tidal-streams — the page, live
07 · TWO PATHS · PUBLISHED
The same arrows once more, as a web page: currents_web.py writes one HTML file with folium, and the browser does the drawing — pan, zoom, a play button.
Open the file on your laptop. If it plays there, it plays anywhere.
Then one workflow file from assignments/pages.yml: on every push, GitHub runs the same command you ran and publishes the result at you.github.io/your-repo.
site/ is never committed. It is made fresh from data/ every time.
on:
push:
branches: [main]
jobs:
build:
steps:
- uses: actions/checkout@v4
- uses: astral-sh/setup-uv@v6
- run: uv run currents_web.py
- uses: actions/upload-pages-artifact@v3
with: { path: site }
deploy:
needs: build
steps:
- uses: actions/deploy-pages@v4
QUESTION · SHORT ANSWER
One line. For example: rainfall · HKO daily extract · JSON.
Not sure yet? Say the phenomenon on its own and we will find you a file.
ClassPoint · short answer — answer on the projector
08
YOUR NUMBERS, YOUR REPO, YOUR FIRST PICTURE
08 · WORKSHOP
Everything for the next two hours is one folder in the course repo, and the walkthrough is its README:
git pull brings it down; uv run tides.py is the first thing it asks for.Everything in week03/ runs from the cached files in data/, so it works with the wifi off. Leave with a repo, a data file and one picture in it.
08 · WORKSHOP
0:00 uv run tides.py
The year, cached to data/, and today's 24 numbers as a text chart. D2 on the real file.
0:15 One day, four ways
plot_day.py, tide_clock.py, tide_month.py, moon.py. Predict, run, change one knob.
0:40 Make it move
animate.py sweeps the clock and writes a GIF into out/.
0:55 Three numbers
earthquakes.py — a map sized by magnitude; currents.py — week 2's arrows back on the map, moving.
1:10 Same idea, messier
typhoons.py — an HTML table, wind against pressure.
1:20 Your repo
New repo, the tree from the brief, your file cached, one plot, the check, the workflow, the URL on Canvas.
1:50 Upload
Your plot to ClassPoint. Caption: phenomenon · source.
QUESTION · IMAGE UPLOAD
Caption, 50 characters or fewer: phenomenon · source.
e.g. "tide at Quarry Bay · HKO hourly JSON" (36 characters)
ClassPoint · image upload — answer on the projector
Week 4: interfaces. Assignment 2 is due Sunday 4 October.
SD5913.GITHUB.IO/TEACHING